Solar and Batteries Led New U.S. Power Plants in Early 2026
EIA data analyzed by Inside Climate News show 368 utility-scale plants began operating from January through June, with solar and storage far ahead of fossil additions.
Today’s Progress
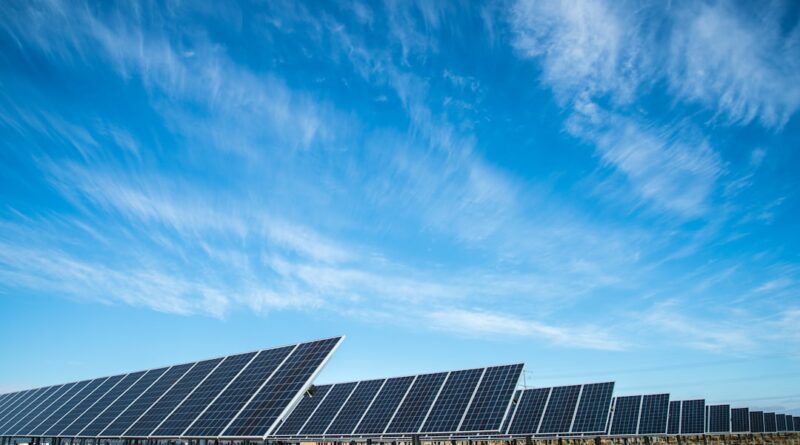
In the first half of 2026, 368 utility-scale power plants began operating in the United States, according to U.S. Energy Information Administration data analyzed by Inside Climate News reporter Dan Gearino. Utility-scale solar dominated both project counts and new generating capacity.
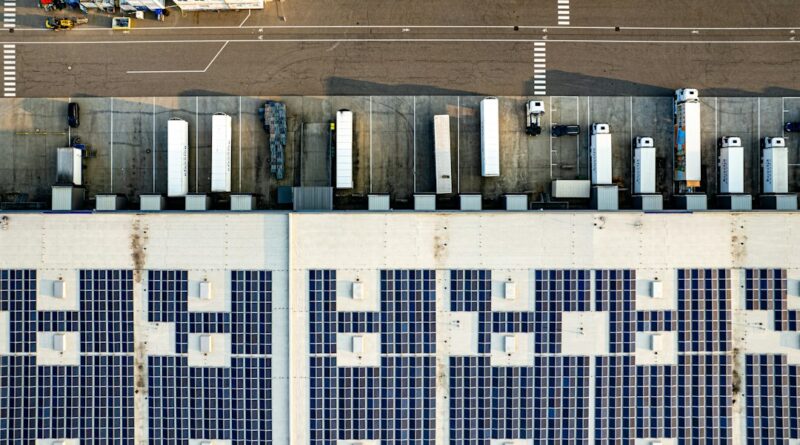
Solar accounted for 207 of the new plants and 11,458 megawatts of capacity. Battery storage followed with 95 projects and 8,207 megawatts. Onshore wind added 5,473 megawatts across nine projects—driven largely by the SunZia Wind South and SunZia Wind North facilities in New Mexico, which came online in the spring with a combined 3,650 megawatts and rank among the largest wind farms in the country.
Fossil additions were smaller. Natural gas combustion turbines numbered 22 projects; natural gas internal combustion engines, 21; and combined-cycle gas plants, only three. Together, the three largest categories of new natural gas plants added 2,707 megawatts—well below solar, batteries, or wind on a capacity basis.
Gearino noted that the completion list is “dominated by utility-scale solar,” and that the much-discussed wave of large gas plants still sits mostly in development pipelines rather than in operation. One hybrid project that illustrates the clean-build pattern is Utah’s Green River Energy Center, with 400 megawatts of solar paired with 400 megawatts of batteries.
Separate EIA inventory reporting covered by energy trade outlets found U.S. utility-scale battery storage near 52 gigawatts by mid-2026 after roughly 8.3 gigawatts of additions in the first six months—figures consistent with the half-year plant tally.
Primary reporting: Inside Climate News.
Why This Matters
What reaches commercial operation is a clearer signal than announcements or interconnection queues. New solar and battery capacity already on the grid can displace higher-emitting generation when the sun is strong and can shift clean energy into evening peaks, reducing reliance on gas peakers for flexibility.
The half-year gap between clean capacity that actually started and gas capacity that started is concrete. Solar alone added more than four times the megawatts of the main new gas categories combined. Batteries add dispatchable support that helps integrate variable renewables without locking in decades of fuel burn at the same scale as new combined-cycle fleets.
That does not erase future gas risk. Gearino and other coverage note large amounts of gas capacity still announced for later years, partly tied to data-center load growth. The present benefit is the fleet that is already generating and storing power today.
Evidence and Context
Evidence stage is demonstrated: plants are listed as having begun operation, not merely permitted or financed. The source is federal EIA generator inventory data, interpreted by a specialized nonprofit newsroom. Capacity figures are nameplate and do not by themselves prove a fixed tonnage of avoided emissions; actual displacement depends on regional dispatch, retirement schedules, and load growth.
Limits matter. Six months is a snapshot. Wind project counts were low outside SunZia, reflecting broader headwinds for onshore wind. Gas combined-cycle completions were few in this window, but development pipelines remain large. Battery megawatts are storage power ratings, not continuous generation. Land use, interconnection costs, and supply chains for panels and batteries carry their own impacts that this plant list does not resolve.
Trade-offs include continued operation of some older fossil units under reliability orders in parts of the country and rising electricity demand. The clean-capacity lead in H1 2026 is real; it is not a full decarbonization of the U.S. power system.
What Made This Possible
Multi-year project pipelines, falling equipment costs, and prior federal and state incentives helped projects that broke ground earlier finish in 2026. SunZia’s decade-scale development shows how long large transmission-linked wind can take. Hybrid solar-plus-storage designs, such as Green River, reflect developer strategies to firm solar output and improve project economics.
Progress Toward Global Goals
The buildout aligns defensibly with SDG 7 (Affordable and Clean Energy) by expanding operational renewable generation and storage capacity, and with SDG 13 (Climate Action) to the extent new clean capacity reduces the carbon intensity of electricity relative to fossil alternatives. Alignment is partial: the data do not quantify national emissions cuts for the half-year, and new gas plants still came online. No UDHR article is directly implicated.
Building on This Success
The following possibilities were generated with the assistance of AI to explore how this progress might be improved, expanded, or adapted. They are ideas for further investigation, not established findings or recommendations from the people featured in the original reporting.
Faster interconnection reform could shrink the lag between shovel-ready solar and storage and commercial operation, tested by tracking median queue-to-COD times by technology. Regional planners might prioritize hybrid solar-storage zones near retiring peakers, measured by peak-hour clean share and peaker run-hours. States facing data-center load growth could pair large-load interconnection rules with verified clean-capacity matching, audited annually against actual generation mixes.
What does the first-half 2026 plant list show about what actually reached the U.S. grid?
Through three lenses—capacity mix, flexibility, and pipeline risk—the list shows solar and batteries as the main technologies that finished, not the gas boom often emphasized in forward-looking headlines. Intervention ideas stay conditional: grid operators could publish quarterly “COD vs. announcement” scorecards (actor: ISOs/RTOs and EIA; mechanism: standardized public tables; obstacle: inconsistent commercial-operation definitions; test: share of announced MW that reach COD within three years). Community benefit agreements on large hybrids could link local air-quality monitors to project milestones (obstacle: monitoring cost; test: PM2.5 and NOx trends near retired peakers). Transmission co-planning with storage might raise deliverability of wind like SunZia (test: curtailment rates and evening net-load contribution).
What Readers Can Watch
- EIA Preliminary Monthly Electric Generator Inventory updates for July–December 2026 completions versus H1.
- Whether combined-cycle gas CODs accelerate in 2027–2028 as announced pipelines mature.
- SunZia and other large wind/storage output and curtailment once fully integrated.
- State and regional clean-share metrics during summer peaks as battery fleets grow past 50 GW.
What Readers Can Do
- Read the full Inside Climate News analysis and EIA generator inventory methodology for primary figures.
- Follow state public utility commission dockets on interconnection and large-load tariffs where new plants and data centers interconnect.
- Support independent energy and climate journalism that tracks operating capacity, not only press releases.