China’s CO2 Emissions Fall as Clean Power Outpaces Demand Growth
Analysis for Carbon Brief finds China’s energy and industry CO2 fell about 0.3% in 2025 and stayed flat or falling for 21 months, even as electricity use rose.
Today’s Progress
China’s carbon dioxide emissions from energy and industry likely fell in 2025 for the first full year in which demand for energy was still rising, according to analysis for Carbon Brief by Lauri Myllyvirta of the Centre for Research on Energy and Clean Air (CREA).
Emissions dropped roughly 1% in the final quarter of 2025. For the full year, CREA estimated a 0.3% decline. Fossil-fuel CO2 rose an estimated 0.1%, more than offset by a 7% drop in cement-process emissions. Official Chinese statistics later reported the same 0.3% decline for energy and industry emissions, Carbon Brief noted in its March 2026 China Briefing.
The pattern stretches further back. CREA found emissions had been flat or falling for 21 months from March 2024 through the end of 2025—the longest such stretch not tied to a collapse in power demand. Power-sector emissions fell about 1.5% year-on-year in 2025. Transport emissions fell about 3%, metals about 3%, and building materials about 7%. The main exception was chemicals, where emissions rose about 12% on higher coal and oil feedstock use.
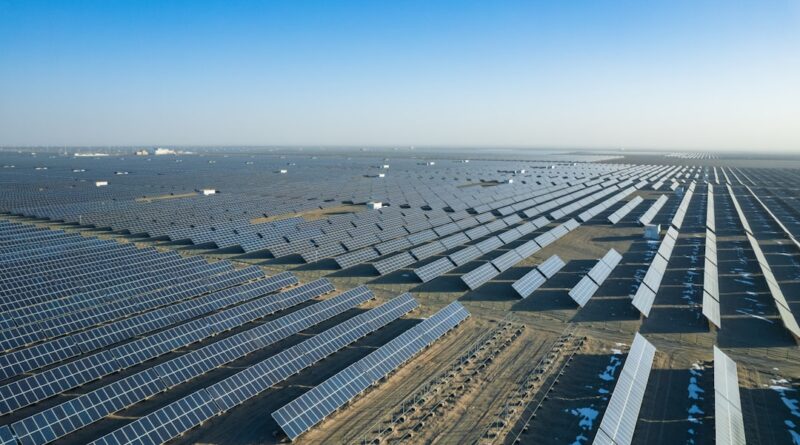
Clean generation did the heavy lifting in power. Solar output rose about 43% year-on-year, wind about 14%, and nuclear about 8%, helping cut coal-fired generation by roughly 1.9%. Energy-storage additions of about 75 gigawatts outpaced the estimated 55 GW rise in peak demand.
Coverage in outlets such as E&E News by POLITICO placed the Chinese data against U.S. rollbacks of climate rules. GNN’s focus is the measured Chinese outcome and its drivers, not the political contrast.
Why This Matters
China accounts for roughly one-third of global CO2. A plateau or peak in its emissions changes the arithmetic of remaining carbon budgets far more than equivalent moves in smaller economies. CREA’s finding matters because the dip occurred while electricity demand grew—evidence that clean capacity, not only recession, can bend the curve.
The current benefit is modest and still provisional. A 0.3% annual drop is a fraction of what pathways to mid-century carbon neutrality require. Myllyvirta has stressed that year-to-year moves of this size are largely symbolic; the important shift is that emissions are no longer climbing rapidly as they did through 2023. Whether 2025 marks a durable peak remains an open empirical question.
Evidence and Context
Strengths: two independent lines—CREA’s bottom-up fuel and sector analysis published in February 2026, and subsequent official statistics—point to the same full-year figure. Sector detail and power-mix data are transparent in the Carbon Brief piece.
Limits are material. Margins of error around coal consumption mean CREA labels the year “flat or falling” rather than a certain drop. Chemicals emissions rose sharply. China continues to add thermal capacity; CREA’s mid-2026 snapshots show thermal additions running ahead of generation growth in some months, raising curtailment risk.
Early 2026 data complicate the story. CREA analysis for Carbon Brief found energy and industry CO2 rose about 2% in the first quarter of 2026. Inflexible coal-plant and grid management left more wind and solar unused: curtailment reached roughly 9.2% for solar and 8.5% for wind early in the year, per reporting that cited Bloomberg figures. Power-sector emissions would have been roughly flat without that wasted clean output. CREA’s July 2026 monthly snapshot later showed CO2 falling again that month as fossil power generation and output of coal, cement, and crude steel eased—so the 2026 path is uneven, not a confirmed second-year decline.
Trade-offs include ongoing coal-plant construction framed as backup, real-estate weakness that cuts cement and steel demand (helpful for CO2, costly socially), and a chemicals build-out that still lifts emissions.
What Made This Possible
Record wind and solar deployment, rising nuclear and hydro output, and rapid growth in battery storage allowed clean supply to cover demand growth in 2025. Soft construction demand reduced process emissions from cement and steel. Policy targets for non-fossil energy and industrial restructuring set direction; market and provincial implementation determined the pace.
Progress Toward Global Goals
The 2025 decline and multi-month plateau align defensibly with SDG 13 (Climate Action) by reducing absolute CO2 from the world’s largest emitter while energy demand rose. Expansion of solar, wind, nuclear, and storage supports SDG 7 (Affordable and Clean Energy) on the clean-share dimension. No SDG is clearly undermined by the emissions result itself; continued coal capacity additions remain a tension with deep decarbonization pathways under SDG 13.
Building on This Success
The following possibilities were generated with the assistance of AI to explore how this progress might be improved, expanded, or adapted. They are ideas for further investigation, not established findings or recommendations from the people featured in the original reporting.
Grid flexibility is the binding constraint visible in 2026 data. If provincial regulators required real-time power markets so coal units face low prices when renewables surge, curtailment could fall and the 2025 power-sector decline might resume—testable within a year via official curtailment rates and fossil generation shares. Storage already outpaced peak-demand growth once; repeating 75 GW-class annual additions while prioritizing regions with the highest waste rates would be a second measurable lever. A third path is chemicals: feedstock switching and efficiency standards aimed at the sector that alone grew double-digits in 2025 could remove the largest domestic offset to power-sector gains.
Can China’s clean-power boom turn a tentative 2025 emissions dip into a sustained multi-year decline?
The 2025 result shows clean generation can outrun demand growth at national scale. The Q1 2026 rebound shows that without flexible coal dispatch and fuller use of wind and solar, the same boom can stall. Sustained decline depends less on another year of record installations than on whether operators are required and paid to make room for them hour by hour.
Three Promising Next Steps
- Mandatory real-time electricity markets — National energy authorities could require generators to bid in spot markets so coal plants reduce output when renewable prices collapse; success metric: national wind and solar curtailment back below mid-single digits within 12 months.
- Storage sited for curtailment hotspots — Grid planners and storage developers could target provinces with the highest 2026 waste rates; success metric: measured drop in local curtailment and flat or falling provincial power-sector CO2.
- Chemicals-sector carbon standards — Industrial regulators could cap or price coal-to-chemicals emissions growth; success metric: year-on-year chemicals CO2 growth near zero while output holds.
What Readers Can Watch
- CREA and Carbon Brief quarterly China emissions updates through late 2026 and 2027.
- Official Chinese full-year 2026 energy and carbon-intensity statistics.
- National and provincial wind and solar curtailment rates.
- Thermal versus non-fossil capacity additions and utilization hours.
- Whether China Electricity Council clean-capacity projections (previously above government floors) translate into generation, not idle megawatts.
What Readers Can Do
Readers following the data can use CREA’s public China energy and emissions trend snapshots and Carbon Brief’s China Briefing for primary figures rather than secondary headlines. Support for open emissions inventories and independent energy analysis strengthens the evidence base this story relies on.